Traffic congestion has apparently returned to pre-pandemic conditions as, for the second year in a row, trucking researchers have measured slower average speeds for truckers along U.S. highways. So, which highways are the biggest chokepoints?
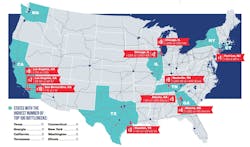
The American Transportation Research Institute (ATRI) released its annual list of the worst bottlenecks for trucks in the U.S., revealing that for the fifth consecutive year, the New Jersey side of the George Washington Bridge, where I-95 and State Route 4 intersect in Fort Lee tops the list.
According to ATRI, the 2023 Top Truck Bottleneck List analyzed more than 300 locations on national highways using a database of truck GPS data. ATRI converts this GPS dataset into an ongoing, proprietary bottleneck analysis and research methodology to identify not only congested corridors, but also granular chokepoints in the nation’s freight system and average traffic speed hour-by-hour.
ATRI measured the average rush hour truck speed to be 36.3 mph, which is 6.1% slower than 2022’s report. Of the nation’s top 100 bottlenecks, almost half saw average truck speeds of fewer than 45 mph over a 24-hour period—not just rush hour.
“Clearly we’re seeing a rate of return to pre-pandemic traffic conditions,” said ATRI president and CEO Rebecca Brewster.
Brewster said that ATRI’s bottleneck data is valuable to carriers, who can view hourly congestion rates at each of the top 100 chokepoints. She said fleets have told ATRI they use the data to schedule more efficient pick-up and delivery time with their customers, avoiding the worst traffic times.
Brewster also said the data is used by governments looking to identify and improve outdated infrastructure, citing construction on Chicago’s Jane Byrne Interchange (formerly known as the Circle Interchange) as an example of an expansion project begun in 2013 that was spurred by ATRI data. Construction was completed in December 2022, and the interchange has dropped from being the country’s No. 1 bottleneck to being No. 6.
Speaking on the Infrastructure Investment and Jobs Act, Brewster said, “I do think, certainly, the industry has applauded the infrastructure bill,” but, “the reality is we’re going to feel a little pain up front for a little bit. A lot of times we see a location pop up on the bottleneck list because of construction.” Take, for instance, I-294 at I-290/I-88 in Chicago, which is No. 2 on this year’s list.
American Trucking Associations president and CEO Chris Spear commented, “The past year-plus has shone a spotlight on our supply chains, and how congestion and other pressures can hurt the American economy and consumers. ATRI’s bottleneck report highlights the areas of our transportation network in need of investment so we can get goods and people moving. The cost of doing nothing is felt in needless delays, wasted fuel and time.”
1. Fort Lee, New Jersey: I-95 at SR 4
2. Chicago: I-294 at I-290/I-88
3. Houston: I-45 at I-69/US 59
4. Atlanta: I-285 at I-85 (North)
5. Atlanta: I-20 at I-285 (West)
6. Chicago: I-290 at I-90/I-94
7. Los Angeles: SR 60 at SR 57
8. Los Angeles: I-710 at I-105
9. Nashville, Tennessee: I-24/I-40 at I-440 (East)
10. San Bernardino, California: I-10 at I-15
This article originally appeared on FleetOwner.com.


