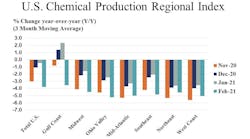
The U.S. Chemical Production Regional Index (U.S. CPRI) fell 3.6% in February, following a 0.7% gain in January and a 1.3% gain in December, according to the American Chemistry Council (ACC).
During February, chemical output fell in all regions as winter storms disrupted chemical production in the Gulf Coast and other parts of the country that rely on raw materials from the region. Chemical output for the Gulf Coast region fell 5.8% compared with January, the largest monthly drop since September 2008 and the second-largest drop in the series, which goes back to 1988. The U.S. CPRI is measured on a three-month moving average (3MMA) basis.
As measured on a 3MMA basis, chemical production fell sharply in categories except consumer products, manufactured fibers, fertilizers and other specialty chemicals. The largest declines occurred in petrochemical and other organic chemicals and plastic resins. Smaller declines were seen in the production of inorganic chemicals, coatings, adhesives and pesticides.
As nearly all manufactured goods are produced using chemistry in some form, manufacturing activity is an important indicator for chemical demand. Following six consecutive months of gains, the manufacturing recovery stumbled in March, with overall factory activity off by 0.4% (3MMA). The 3MMA trend in manufacturing production was mixed, with gains in output of food and beverages, aerospace, machinery, semiconductors, iron and steel, foundries, plastic products, rubber products, paper, structural panels, textiles and apparel, and furniture.
Compared with February 2020, U.S. chemical production remained off by 3.8%, the twenty-first consecutive month of year-over-year declines and a deterioration from recent progress. Chemical production was lower than a year ago in all regions.
The chemistry industry is one of the largest industries in the United States, a $565 billion enterprise. The manufacturing sector is the largest consumer of chemical products, and 96% of manufactured goods are touched by chemistry. The U.S. CPRI was developed to track chemical production activity in seven regions of the United States. The U.S. CPRI is based on information from the Federal Reserve, and as such, includes monthly revisions as published by the Federal Reserve. To smooth month-to-month fluctuations, the U.S. CPRI is measured using a three-month moving average. Thus, the reading in January reflects production activity during November, December, and January.


