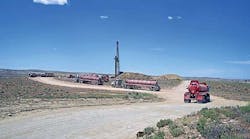
SHALE gas has been a game-changer in US natural gas markets and has improved the competitiveness of American manufacturing, especially chemicals, according to Martha Gilchrist Moore, senior director of policy analysis and economics for the American Chemistry Council.
“The location of shale gas will foster new green-field investment, generating new business, jobs, and tax revenues, with reaccelerating growth and the US capturing global market share,” Moore said. “There’s a promising future. With global integration and renewed competitiveness, exports gain as a share of output. In addition to shale gas, new materials through nanotechnology and processes like bio-based chemistry will also lead to enhanced growth.”
In her recent presentation, “American Chemistry: Brief Overview, Situation, and Outlook,” Moore painted a glowing picture for the chemical industry, and as a consequence, for the tank truck industry.
She said American chemical manufacturers apply the science of chemistry to make innovative products and services that make people’s lives better, healthier, and safer—resulting in a $770 billion enterprise that supports nearly 25% of US GDP, is the top exporting sector, and features 14,000 chemical manufacturing sites and 780,000 chemical industry employees.
End-use markets include appliances, automotive and other transportation, building and construction, plastic and rubber products, and textiles and apparel.
“Each one faces its own set of industry dynamics and global competitiveness issues, so we try to keep track of these on your behalf,” Moore said.
American renaissance page 2...
Within the chemical industry, 42% of production is basic chemicals. In terms of distribution of overall chemicals, 847 million tons are handled, 54% of which travels by truck. These chemicals are valued at around $45 billion.
In Moore’s macroeconomic outlook, exports and business investment are slowing, housing and vehicles rebounding, household deleveraging is over, there is a two-speed manufacturing recovery, and the global economy remains weak, with a recession in Europe and a slowdown in China.
A breakdown of some of the elements:
• Indicators of economic progress. “They continue to lag. The end of the recession was June 2009. We’ve been climbing out ever since. It’s been four years now and we’re still below average. This one is different structurally from other recessions you see, like 1983.”
• Housing starts and building permits. “About $15,000 of each housing start includes chemistry directly or indirectly, in coatings and laminates and wire insulation. We are seeing definite improvement in the housing market. We expect housing starts to reach over a million in 2013. They were 2.2 million in 2006, but we don’t anticipate it being that high again.”
• Light vehicle sales. “$3,000 of each new vehicle is a chemistry product directly or indirectly. Increasing amounts of plastic components are driving chemistry to the vehicle market. They’re looking to improve to 13.3 million units this year. During the recession, people held off buying for a long time.”
• Industrial production outlook. “96% of the manufacturing sector uses chemistry in some form or another, whether packaging or other direct or indirect input. We’re looking at a 2.9% increase in industrial production this year. The global economy has really put a damper on industrial production in the United States, although we are one of leading countries. It should accelerate in 2014 and 2015 as the global economy picks up.”
• Outlook for end-use markets. “The consensus is that the growth rate is strong in motor vehicles and parts, aircraft and parts, fabricated metal products, iron and steel and construction, furniture, structural panels, while not strong in printing, paper, and apparel.”
American renaissance page 3...
Moore said the Chemicals Activity Barometer (CAB) is a composite index of economic indicators that track the activity of the chemical industry and is important because due to its early position in the supply chain, chemical-industry activity leads that in the overall economy. The CAB can be used to anticipate potential turning points in the overall economy.
She said the industrial production index has been following CAB, and modest growth is expected.
“The economy is fragile and vulnerable to shocks,” she said. “The risk of recession remains present: around 25%. Consumers are in the best position in years. The employment situation is slowly improving. Deleveraging has ended and higher consumption growth will resume in the years ahead. The housing sector is leading the parade in the recovery with automakers and aerospace, but other industries continue to lag.
“Some uncertainty has been removed, but longer-term demographic pressures on entitlement programs remain the elephant in the room. Like other developed nations with high debt, ageing populations, and fiscal challenges, the US is on a lower long-term growth track. Global growth will continue to shift toward emerging markets.
“The chemical industry started 2013 on a strong note, and key end-use markets are improving. Growth through the end of 2013 will be constrained, however, by weak export markets, and continued slow recovery in the United States.”
She said chemicals, excluding pharmaceuticals, have had an average increase of 2.5% a year, but that’s not factoring in “the tremendous amount of investment in shale gas being produced. When you factor that in, we will average 4% in chemical-industry output. By 2020, it’ll be 9% higher than what some of models are projecting.”
Moore said that between 2005 and 2012, US energy prices were falling in either absolute or relative terms. “Oil prices are very high and natural gas prices are comparatively quite low,” she said. “We’re very advantaged right now.”
The global ethylene supply curve measuring petrochemical production costs by country/region “has changed dramatically because of shale gas. The US is now among the low-cost producers.”
Incremental US chemical industry investment: 58% in bulk petrochemicals, 23% in plastic resins, 15% in fertilizers, and 4% in inorganic chemicals. By region, the Gulf Coast leads at 78%, followed by the Ohio Valley (13%) and Midwest (8%). ♦


